The other day, I was asked to make an Excel spreadsheet that was populated by a SQL stored procedure parameterized. This spreadsheet is supposed to run each month to analyze the previous month’s sales and commissions. I wrote a stored procedure that automatically pulled the previous month’s data. Now, they wanted to specify the Start Date and End Date.
I searched all over the internet on how to do this, and while I am not sure that my solution is the most efficient, I decided to write this up to help anyone who might have this problem, or if there is a better way to do it.
The report is called Monthly Financial Analysis and pulls data from an SQL database stored procedure I wrote called usp_GetEndOfMonthSalesMaster. This stored procedure will accept a Start Date and an End Date, but if not supplied, automatically selects the previous month’s data.
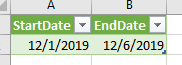
In the Excel spreadsheet, I created on Query that called the stored procedure. To get the parameters, I created a second sheet that only contains the parameters. I created a named Table that encompassed the parameters.
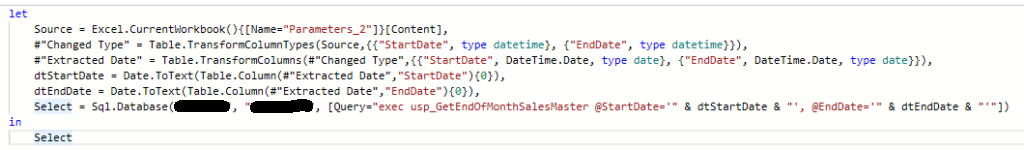
In the my Query, I used the Advanced Editor. I started by selecting the Parameters table as a Source and then got to the data via the Table.TransformColumns command. Once I had the Extracted data, I set variables dtStartDate and dtEndDate via the Date.ToText function, as illustrated below so I could include them in the SQL Query.
PowerQuery M formula language query
Calling the stored procedure takes place in the Sql.Database connection command. After specifying the server and database name. In the options of the method, you can provide the Query text. This is where you can use the date variables.
This took me a while to figure out. I didn’t even know there was a PowerQuery M formula language to use so I had to try to understand how that worked. If anyone has a better way to do this, please provide comments so we can all learn from your expertise.
Last year, I decided that I wanted to learn different ways to create web applications. The two major candidates were Angular 1.x and ReactJS. I went through some courses on Pluralsight and other training sites for both. After “playing” around with both, I can honestly say that I prefer ReactJS over Angular. Angular 2.0 looks promising, but I think some of the same reasons I choose React over Angular still exist:
Angular supplements HTML with its own attributes and puts javascript in HTML. React is straight Javascript.
You have to learn a whole framework with Angular. With React, I can choose my own ecosystem.
One thing I read, is that because React is just javascript, it teaches you to be a better JavaScript programmer.
React is focused on doing one thing and being the best at it. It makes UI’s fast! The virtual DOM just makes sense to me.
Data flow in React is one way. It flows down from the top and state is passed back up. That makes sense to me.
I’ve been developing React apps on NodeJS but I’m a SharePoint Developer. I kept wondering if I could write Single Page Apps (SPA) for SharePoint.
Basically, my requirements were:
Write a ReactJS app that would compile down to a static JavaScript file that I could embed in a Content Editor Web Part.
Use SharePoint’s REST interfaces to access the SharePoint objects.
Since this would be hosted on SharePoint, I didn’t need to worry about cross-domain authentication.
Use React Router to control app routing.
Create a workflow that would allow me to easily develop and deploy these apps to SharePoint.
With the recent guidance from Microsoft about the SharePoint Framework, I thought this was the perfect time to attempt to write a React app on SharePoint.
After a lot of research, I found a couple of things.
There is a project called ReactJS.NET that makes using React with .NET easier. It focuses on the .NET MVC pattern. I looked at that, created some demos but it didn’t fit my requirements. I didn’t want to have to deploy compiled C# code to a SharePoint server.
I decided to start rolling my own solution. I chose
ReactJS
NodeJS
Babel (to transpile JSX)
npm (to load the node packages and run scripts
Webpack to bundle them into static files
I was trying to put this all together when someone recommended that I check out the team at Facebook Incubator’s create-react-app bootstrapper. After looking through the demos. Installing it myself and creating some quick (albeit small) apps and getting them to run on SharePoint, I think I have found my solution.
A couple of challenges.
How do I develop on NodeJS without connecting to the SharePoint REST interfaces?
How do I deploy the created app to SharePoint.
The answer to the first question was to create a “dummy” REST interface for development. I created the lists that I needed in SharePoint and then used Postman to call the REST interfaces and grab the data that was returned. I copied that data object into my React App as the data source and then created an API module that would use the local data instead of calling SharePoint. Since we can request a JSON object from SharePoint using the Accept header, it was easy to recreate the API necessary using array methods. Once the app was developed using my dummy API, I substituted my real API that actually called the SharePoint REST endpoints.
The second question posed more of a problem. I planned to put my app on a web part page by referencing it in a content editor web part. For years I have been storing custom code in the Site Assets library. You could also create a CDN to host your app code. Either way, your development workflow needs to be able to copy the static files from your production build, to SharePoint. My original solution was to upload them via the web interface. This worked but it was too cumbersome. My next solution was to map a drive to Site Assets folder in SharePoint. This works some of the time, but this also is cumbersome. I recently read about an npm module called spsave. I’m going to try to work it into my workflow. This should allow me to automatically deploy my files to SharePoint when I run the build command.
I put together a presentation about my work to get React to work in SharePoint. It’s still a work in progress. I delivered the presentation at SharePoint Saturday – Kansas City on October 1 and then again in Minneapolis for SharePoint Saturday – Twin Cities. My slides are linked below but the best thing to do would be to look at the code of the Contacts app I created for the presentation. It’s a simple app but demostrates the use of a dummy API to develop with. The github link to the code is below also.
I plan on continuing to improve my demo and adding to it. I think I’m going to add some tests and I still need to add a delete function. If you are interested, go ahead and star my repository. If you find an error in the code, or a better way of doing something – I’d love to hear about it! Remember, I’m still learning so be kind!
If you notice the previous posts, it’s been since 2014 since I have been doing any writing on this blog. I have been a little busy. I will write more in detail abou what I have been up to in a future post, but until then, know that I have not stopped doing SharePoint Consulting, or doing some cool things in SharePoint and Office365 with other web technologies.
In future posts, look for topics like:
One page apps using AngularJS and SharePoint REST.
One page apps using ReactJS and SharePoint REST.
Easy ways to display list data using jQuery.
Interesting SharePoint layouts using Bootstrap!
Also, I am still the leader of the Omaha SharePoint User Group. I am in need of speakers for our monthly meetings. If you want to present at our meeting, contact me and we’ll get you on the schedule.
One more thing. Our 4th Annual SharePoint Saturday will be held on April 9, 2016. More information on that will be coming but it goes without saying that we are looking for speakers for that conference also.
I promised that I would upload my slide deck from this presentation but after looking at the slides, it appears that the only thing worthwhile are the links that I provided for further study. So, without further ado, here are the references:
SharePoint Foundation 2010 Client Object Model Redistributable
I have received some positive feedback on this article series. Thank you! I thought I’d go ahead and create this post with links to each post in the series to make it easy to read the whole thing in order. I also want to thank EndUserSharePoint.com for picking up the series, making it available to many more people. As always, if there is a particular subject you would like to know more about, send me an email and I’ll try to write something about it.
In the first four parts, we saw how easy it is to set up a couple of lists and then with just a little bit of JavaScript, we can transform that list data into an Org Chart or a graphical Site Map. This shows you how a little out-of-the-box thinking can produce great results.
When we last left our Site Map, it looked like this in IE.
As displayed in IE
The structure is all there but it looks completely different in browsers such as Chrome.
As displayed in Chrome
The reason the displays are different for each browser is because of the CSS used to render the boxes. Google uses some specific css that IE prior to version 9 does not recognize:
If you look closely, there are a couple of tags that specify the rounded corners and the shawdow, namely, border-radius and box-shadow. These are found in the CSS3 proposal, the web-kit markup for Chrome and Safari browsers and the mos- markup for the Mozilla based browsers.
Not everyone will be using IE9, so how can we make previous versions look better? While there are numerous rounded corner techniques, I chose to only work on the background and just accept the square corners. Lets begin by inserting a <STYLE> section just before our sitemap <DIV>.
The CSS class that we want to override is .google-visualization-orgchart-node. We can always use a solid color to draw the box but to make it look a little better, I created a small 3px X 395px that had a blue gradient. I can use this as the background and repeat it across the whole box. I chose 395 at random. I don’t think the boxes will ever be larger than 395px but I also wanted it small enough that I could see the gradation in the smaller boxes. If the boxes do get larger than 395px, then my background-color attribute is the same as the end color of my graphic. I named the graphic ‘background.gif’. Upload the graphic to the images folder you created in the second post. Once the file is uploaded to the server insert following CSS into your style section.
You will notice that I also took some liberty in trying to make the boxes look a bit uniform. I did this with the padding and setting the height. I also want to make sure that the contents of the box do not wrap. The key takeaway, it that you can configure each node however you want. Our final look in both IE and Chrome are:
IE Final
Chrome Final
I hope you have enjoyed this series. I love creating solutions that might look difficult but in reality, are pretty easy. This also shows how powerful SharePoint Web Services can be. If you haven’t worked with SPServices library in the past, check it out. With a little OOB thinking, you can create some cool solutions.
I hope my instructions have been clear enough so that your chart looks like mine, but if not, you can download my code SiteMap and the background.gif file here.
Now that we have the basic chart, it’s now time to add content to each box from the Site Map Content List. I could get all of the content of the list and then iterate through them for each node in the Site Map list, or I could write a short function that queried the Site Map Content list at the time I was drawing the node. Since my site map was small and I knew it wouldn’t get much larger, i chose the second option. It would not be hard to code the first option either.
I called this function GetContent and I place it outside of my $(document).ready() block.
function GetContent(LookupValue)
{
var out='';
var content, url;
// use SPServices to query the Site Map Content list for all nodes that match the
// LookupValue. Grab the Title, Url, Position and SiteMapNode fields.
$().SPServices({
operation: 'GetListItems',
listName: 'Site Map Content',
async: false,
CAMLViewFields: '',
CAMLQuery: ''+LookupValue+'',
completefunc: function(xData,Status){
// When the response is received from the server,
// create our content string by iterating
// through each row returned in the response.
$(xData.responseXML).find('[nodeName="z:row"]').each(function(){
url='';
content='';
// if our string has already been started, add a new row to the response.
if(out.length>0)
out+=' ';
content=$(this).attr('ows_Title');
if($(this).attr('ows_Url')!=null)
content='' + content + '';
// add the content string to the output.
out += content;
});
// one requirement I had was to put the Node name at the bottom of the box.
// The easiest way to do this is to add an empty paragraph and then the Lookup Value.
// This is specific to my requirement so you don't have to do this.
out+='
';
out+= LookupValue.wrap('
(',')
');
}
});
return out;
}
Now that we have the content string built, we can plug that function call into our existing code where we are drawing the boxes.
If you go back to the original function that drew the boxes, locate the lines that say:
boxContent=curTitle;
and replace the line with the following code snippet:
boxContent = GetContent(curTitle);
Your site map should now look like the following illustration.
As displayed in IE
As displayed in Chrome
As you can see, it looks quite different in IE than it does in Chrome. The reason behind this is the CSS that is used by Google to draw the boxes. In the last post, we’ll make some CSS changes to make it look better in IE.
In the first two posts, we created our lists and set up our development environment. In this part, we will use jQuery to query the Site Map list and create the Site Map hierarchy. If you haven’t completed the steps outlined in the first two parts, you should do that now. Links to the other posts in the series can be found at the end of this article.
Drawing Boxes
The first thing we are going to do is query our Site Map list and grab all of the list items. We will put all of the code in the document.ready block that we already prepared.
Copy and paste the following snippet of code into the page.
This snippet directs SPServices to use the GetListItems web service and query the list named, Site Map. It specifies that we want to see the following fields: Title, Parent and ID. It also says that we want to Order our data by Parent in ascending order. When we receive the return data, we want to pass that data, xData, to a function for further processing.
So far, our code doesn’t really do anything except fetch the data from our list. We need to parse the results and then format it so that the Google charting API can understand it. We will do this in the function(xData, Status){} block. Copy and paste the following snippet.
	//initialize variables
    var curParent='0';
    var testParent;
    var curTitle='';
    var curId='0';
    var parentId;
    var boxContent='';
    // create a new DataTable object that we will pass to the Google API
    var	data = new google.visualization.DataTable();
    // add the following columns to the DataTable to store the chart values.
    data.addColumn('string','Name');
    data.addColumn('string','Parent');
    data.addColumn('string','Tooltip');
    // SPSServices return the response data in the xData object.  It contains
    // the response in an XML document.  We can then use jQuery to find each
    // row of data in the XML file and act on it.
    $(xData.responseXML).find('[nodeName="z:row"]').each(function(){
        // if this node does not have a parent, then we need to save it to the DataTable
        // differently than the nodes with parents.
        if($(this).attr('ows_Parent')==null)
        {
	    curParent = $(this).attr('ows_ID');
	    curTitle = $(this).attr('ows_Title');
	    boxContent=curTitle;

            //   note the first field in the DataTable. the v:curParent and the
            //   f:boxContent are in the Name field.  The v: represents the Value
            //   while the f: represents the display field.  It may look like we're
            //   saving 4 values to a 3 field table but the first field has a
            //   value and display name part to it.

	    data.addRow([{v:curParent, f:boxContent},'',curTitle]);
        }
        else
        {
	    testParent = $(this).attr('ows_Parent');
	    curTitle = $(this).attr('ows_Title');
	    parentId = testParent.split(';#')[0];
	    curId = $(this).attr('ows_ID');
	    boxContent=curTitle;
	    if(parentId !=curParent)
	        curParent=parentId ;
	        data.addRow([{v:curId, f:boxContent},curParent,curTitle]);
	 }
    });

    // now send it to the Google Visualization API and store the results in 'chart'
    var chart = new google.visualization.OrgChart(document.getElementById('sitemap'));
    // render the HTML of the chart.
    chart.draw(data,{allowHtml:true});
If everything worked right, you should now have an OrgChart based on the values you placed in the Site Map list resembling Figure 1. Figure 1 : OrgChart
That’s promising! This is where it starts getting fun! In the next post, I’ll show you how to get the content for the individual boxes!
In the last post, we defined the requirement and the solution and then created the lists that will support it. In this post, we will assemble all of the parts and set up the coding environment. I will also show you how I organize supporting files when I develop SharePoint solutions.
Note: The structure I use to create client-side solutions using jQuery and the CEWP is the method and structure that I have adopted after trying various ways on various different projects. I know others create Document Libraries to store their code and that is fine. Some even put all of the code in the CEWP. I normally have SharePoint Designer access so I choose to create Folders instead of Libraries. If you don’t have SharePoint Designer access, you can create a Document Library to store your code or place it in the CEWP.
To host the org chart, we are going to use a Content Editor Web Part (CEWP). Using this web part, we can use HTML or JavaScript to create rich content.
Place a Content Editor Web Part (CEWP) into one of the web part zones. Don’t worry about configuring it right now.
Open up your site in SharePoint Designer (SPD).
Create a new folder in the root of the site and name it Resources.
Create four new folders in the Resources folder named content, css, images, js.
If you haven’t already done so, download the jQuery and SPServices libraries.
Place jquery-1.6.2.min.js and jquery.SPServices-0.6.2.min.js into the Resources/js folder you created on your site.
In the Resources/content folder, create a new file called SiteMap.js.
Open the SiteMap.js file for editing in SharePoint Designer (or any other text editor).
Use the following code block to set up your code page.
Go back to the page in your browser where you placed your CEWP. Open the web part for modification and in the Content Link box, type the path of the SiteMap.js file. The path to the file is relative to the site so normally, it would be resources/content/sitemap.js. Test your path to make sure.
Save your changes.
Your environment is now set up. I showed you how I prefer to set up my solution and explained how others have accomplished the same task. The point to remember is that creating these types of solutions are simple and flexible. In the next post, we will start coding our solution.
A client had a requirement to modify an Org Chart that they had on their SharePoint (WSS3) site. When looking at it, I realized that it was an image with the links mapped. The image itself was sliced up pretty good and it was impossible to make the requested modifications because I didn’t have original image to edit.
I looked at different commercial Org Charts but the ones I looked at only displayed contact data either from Active Directory or a custom Contact List in SharePoint.
I knew that Google had a charting API and when I looked, that included an Org Chart. This API would work perfectly for me since my client wanted more of a Site Map that would illustrate their different department sites with links to each site, I needed to include HTML in the content of the ‘Nodes’ of the Org Chart. I quickly fired up SharePoint Designer and coded some jQuery and HTML to create the chart in a Content Editor Web Part (CEWP). It worked but my client would always need a web developer to make any modifications to the chart. What I wanted to do was to provide them with a solution that would allow them to make modifications to the chart without any developer resources.
I have been working with the wonderful SPServices jQuery library that Marc Anderson has written for sometime. I love the ability to query the SharePoint Web Services with jQuery. It provides some great possibilities. So, I noodled about and came up with the following solution, which I will cover in 5 parts. Please see the end of this post for links to the other parts.
The client wants to display a visual representation of their organization and provide links to their individual team site. The client wants to be able to modify the content and structure of the Organizational Chart without using developer resources. The end result should look like Figure 1.
Figure 1 – Org Chart Result
The Solution
After thinking about this requirements a bit, I thought that Google’s Visualization API, specifically their charting API might give me the tools necessary to actually draw an organizational chart. I knew that I could write some javascript code to access the API so that was pretty simple. I quickly set out to create an organizational chart using Goolgles OrgChart visualization and hard-coded all of the content. This provided the visual result I wanted but not the functional result. An end user would need to know HTML to be able to update the chart. What I wanted to do is to create a couple of lists that would drive the content and structure of the list. The perfect solution for this is Marc Anderson’s SPServices jQuery library for SharePoint Web Services. Marc has done a fantastic job with this library and is constantly updating the code to keep up with the changes in both SharePoint and jQuery. The SPServices library will allow us to query a SharePoint list and then parse the XML that is returned and send that data to the Google API to draw the org chart.
So, now that we have an idea of how we are going to create the solution, it’s time to set up the lists.
Setting up the lists
To make this easy to modify by anyone, I have decided to use two custom lists. The first custom list is to control the structure of the org chart. Two fields are necessary, a name for the node and what it’s parent is. Of course, the first node will not have a parent. I created a list with the following fields:
Field Name
Type
Notes
Title
Single line of text
Parent
Lookup
This lookup field references the Title field in the same list.
Table 1 – Site Map List
Add the following content to the Site Map List
Title
Parent
IT
Database
IT
Systems
IT
Collaboration
IT
Table 2 – Site Map list content
To supply content to each node, I chose to use an additional list that I called Site Map Content. In this list, I needed to define the content line, any URL that the content would link to, the position the content should appear in the node and what node to place the content in. Table 2 illustrates how I created the content list.
Field Name
Type
Notes
Content
Single line of text
Renamed the Title field
Url
Single line of text
Position
Number
set to zero decimal places, minimum number 1
SiteMapNode
Lookup
Lookup to the Site Map list and reference the Title field
Table 3 – Site Map Content List
Now add the following content to the Site Map Content List
Content
Url
Position
SiteMapNode
Director: Jim Smith
1
IT
Manager: Bob Blisand
1
Database
Oracle Team Site
#
2
Database
MSSQL Team Site
#
3
Database
MySQL Team Site
#
4
Database
Manager: Chris Cooper
1
Systems
Microsoft Systems Team
#
2
Systems
Linux Team
#
3
Systems
Manager: Wesley Willingham
1
Collaboration
SharePoint Development
#
2
Collaboration
Web Development
#
3
Collaboration
Table 4 – Content for the Site Map Content List
Now that we have the two lists created, we can begin coding. In the next part of this series, we will set up the environment we will need to code the solution.
 Last year, I decided that I wanted to learn different ways to create web applications. The two major candidates were Angular 1.x and ReactJS. I went through some courses on Pluralsight and other training sites for both. After “playing” around with both, I can honestly say that I prefer ReactJS over Angular. Angular 2.0 looks promising, but I think some of the same reasons I choose React over Angular still exist:


